Alt-F4 #63 - Dana Dev Blog: Spaghetti Recipe Graphs 12-08-2022

After a somewhat lengthy pause, Alt-F4 returns with an issue reminiscent of the good ol’ FFF: A dev blog! Only here, it’s not about the game itself, but a very unique and slightly crazy mod. Credne brought Dana into this world, and it took quite a bit of doing to get there. Lots of technical detail and cribbing ideas from Football ahead, so dive in!
Dana dev’s blog: about the spaghetti in recipe graphs Credne
Dana … What is That?
Dana is a mod that aims at answering a simple common question in Factorio: “How can I make item X?”.
There are already quite a few mods doing this: FNEI, Recipe Book, What is it really used for, etc. These mods have a common approach: Let’s say a new player want to know how to craft the Chemical science pack (the cyan one). This player looks for it with one these mods (or Factorio’s recipe list), and sees there is a single recipe, taking red circuits, sulfur, and engine units. So now the new player wonders “How do I make red circuits?”, looks for it, and sees a single recipe that requires plastic bars, copper wires, and green circuits. Next thought: “How do I make plastic bars?”: One recipe requiring petroleum gas. “How do I make petroleum gas?”: Four recipes, having to inspect them one by one, and so on. That’s time consuming, tedious, and the player is likely to forget some steps (like the sulfur, or steel).
Dana is born out of frustration of having to apply this process for hours on complex mod overhauls, and it takes a slightly different approach to answer these questions:
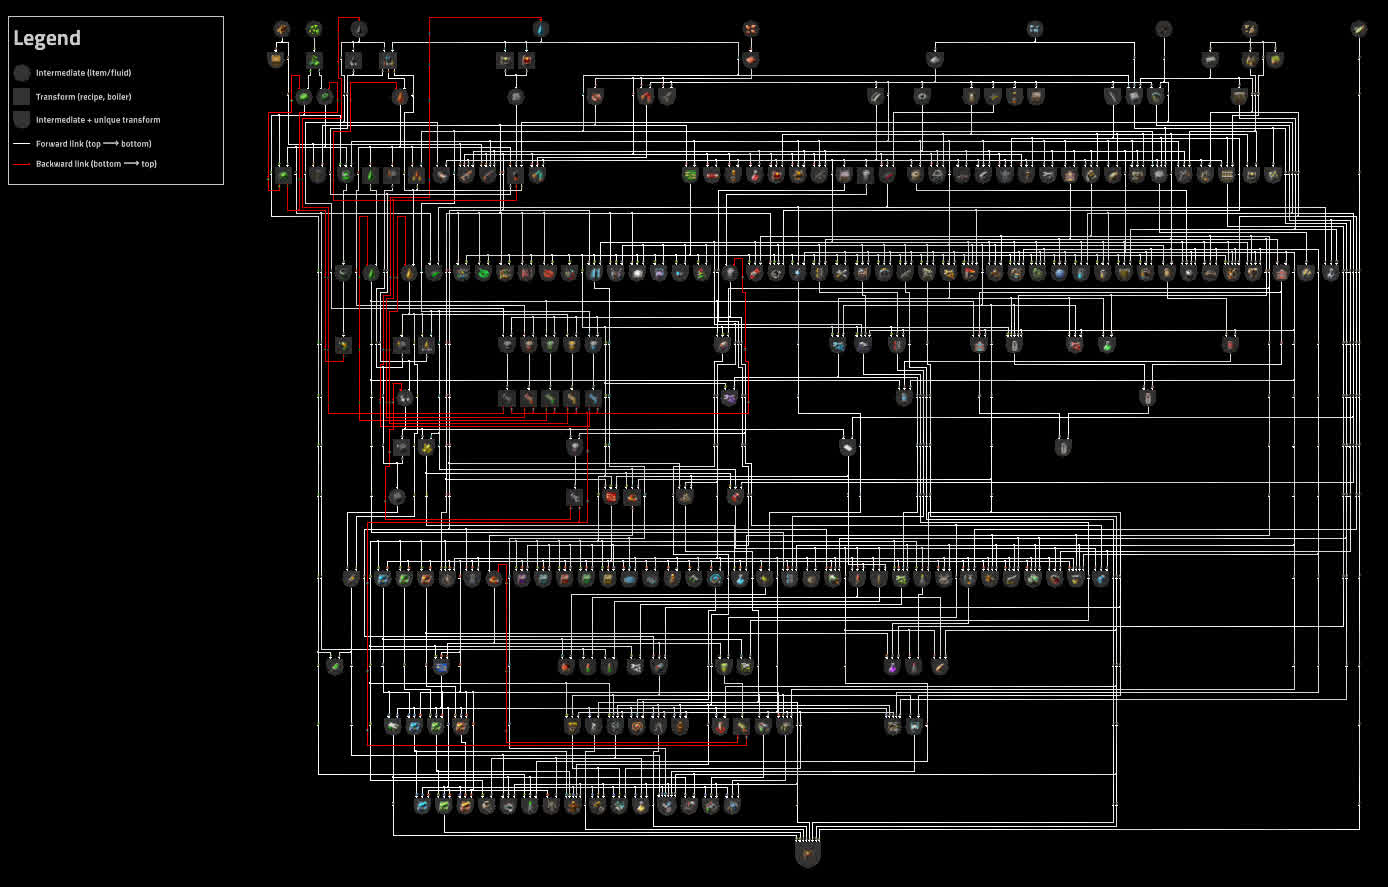
Dana is about depth: When asked how to make a Chemical science pack, it will show you all the chained steps required from the raw materials. And it does so directly in-game, by drawing you a nice™ and understandable™ recipe graph. Players can navigate the graph with WASD, zoom in/out with mouse wheel, and select nodes or links for additional info. It’s also possible to draw the full crafting graph of the current game (the vanilla one will be shown further in this article), or a “usage” graph (i.e., what are all the items that can be crafted from X).
Dana is designed to work out of the box with any combination of mods adding/modifying/removing recipes or items. There is no hardcoded configuration provided by the player, the modders, or shipped directly with Dana. In this video, it placed the “Copper block” between the “Iron block” and the “Refinery block”, the “Heavy oil” above the “Light oil”, decided how the lines should be drawn/merged/bended, what each block’s X-Y coordinates were, and more. All that Dana had to work with was the full list of items, recipes, and what the available natural resources were. This is done by a graph layout algorithm (the piece of code that takes a bunch of recipes/items and decides where to place them on the screen and how to link them) specifically designed for Factorio, which will be the subject of this article.
Dev Blog: Drawing the Graph’s Spaghetti
Today’s post will present some (hopefully interesting) details about the inner workings of Dana’s nice™ and understandable™ graph generator. To give a general introduction, Dana’s graphs are a variant of layered graphs. This means that items and recipes are placed in node layers, separated by link layers.
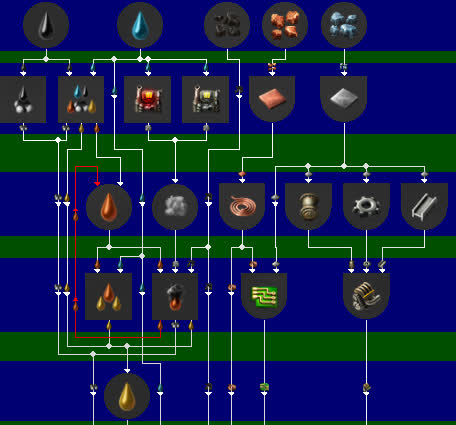
The first thing Dana does is to decide how many node layers are needed, and in which layer each item/recipe will be placed. The second step is to decide the horizontal coordinate of each item/recipe. The third step is to build the link layers. The final step is to assign a vertical coordinate to each element in the graph, now that the number of layers and their height is known.
The full layout algorithm is way too big and technical for an Alt-F4 article, so the rest of this will focus on the third step, which is building the link layers. Here’s the problem: given two consecutive node layers, trace the required links in the link layer, in order to get a nice™ and understandable™ graph:
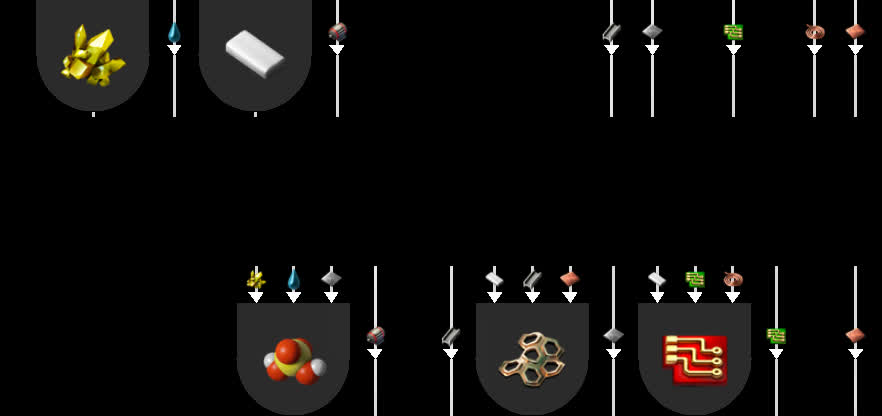
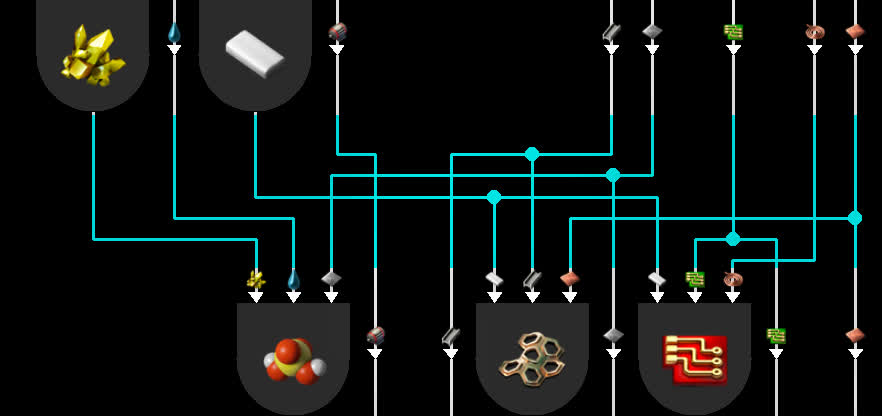
Conveniently, this is more or less a variant of kindergarten exercises:
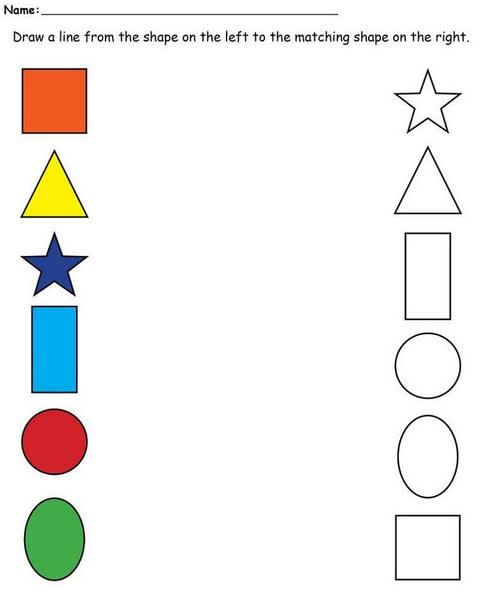
Since 5-year-olds do that, it shouldn’t be hard to program, right?
The Design: “Nice™” and “understandable™” Graph?
First, let’s take a paper and a pencil (or your favorite image editor) and answer an important question: what should the links look like? As one can imagine, what makes a graph nice™ and understandable™ is pretty hard to define.
Maybe simple straight lines, like most graph renderers?
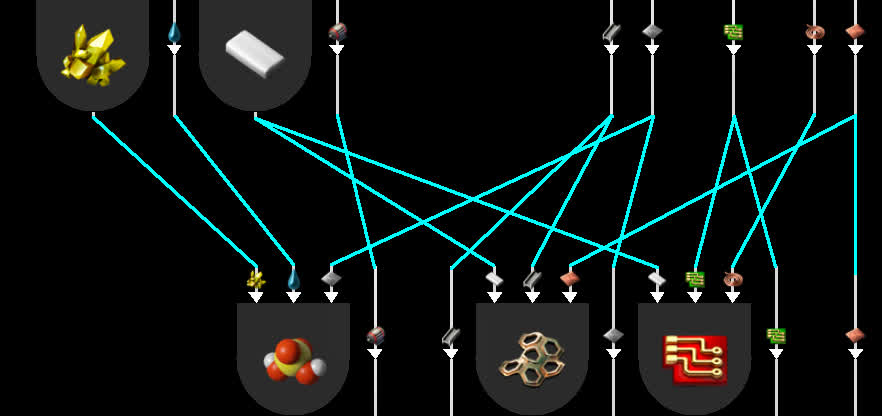

This might get the job done on small graphs, but fails to be nice™ and understandable™ with wide graphs. Nearly parallel lines crossing each other are hard to follow, and areas with a high line density become a block of white. The good old straight line isn’t even enough for Vanilla Factorio crafting graphs, let alone modded ones!
So, back to the drawing board for a nicer™ and more understandable™ solution. Let’s remind ourselves of the general guidelines for user friendliness of graph links:
- Minimise line crossings, especially between almost parallel lines.
- Minimise the bends on a link.
- Minimise the length of links.
On top of that, there are general UI design rules:
- The user experience plummets if they have to scroll horizontally/vertically to cross-check information from different parts of the interface. To avoid that, the graphs must be as compact as possible.
- Less is more: if the same amount of information can be conveyed with four lines instead of twenty, that’s probably a good thing to do.
So now, it’s time to search for better ideas. And the best way to research for anything, as we all know, is by googling pressing “T” in Factorio:
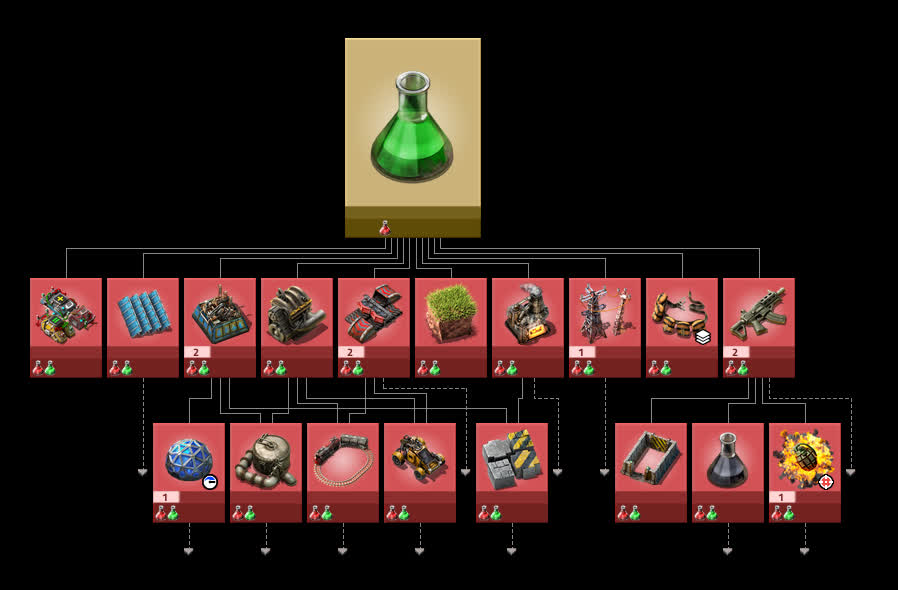
Factorio’s graph renderer has a more subtle way of rendering links. Each link is decomposed into three segments: two vertical, one horizontal. This approach scales much better with wider graphs, because:
- There’s never a crossing of nearly parallel lines. All crossings are at right angle, which is optimal to prevent users from following the wrong line.
- The density of links is kept under control: there’s always enough gap between parallel lines to distinguish them from each other.
The price for this readability is vertical space: there needs to be enough room between two rows of technologies to be able to add all the horizontal segments without getting any collisions:
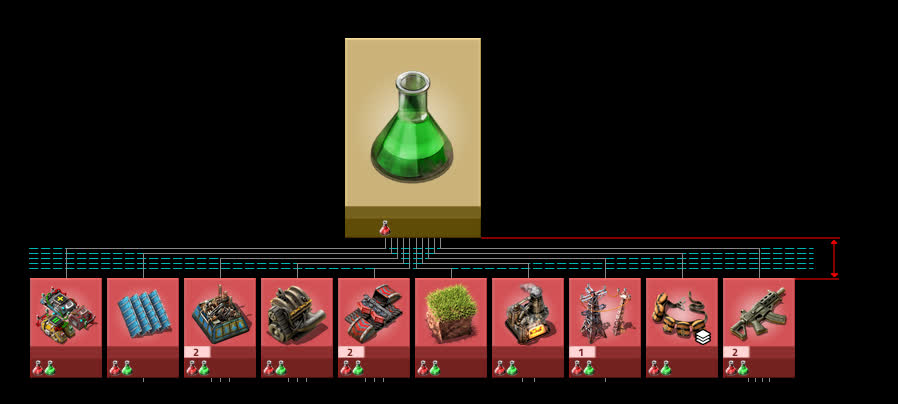
To minimize this cost, there’s a simple yet huge optimisation: What if lines didn’t link just two elements, but any number of elements? Just draw a single wide horizontal line for each item/technology, then add as many vertical lines as necessary to connect to the nodes.
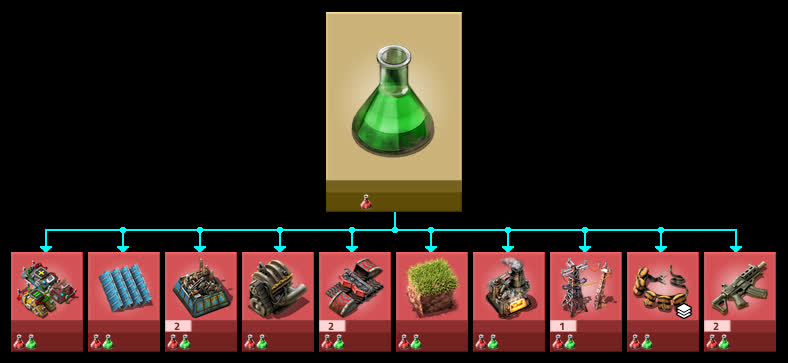
Much more compact, less clutter, definitely nice™ and understandable™. This gives a “main bus” vibe to these graph sections that’ll hopefully feel natural to a Factorio player, while hitting a good compromise between the general guidelines. This is also technically possible with Factorio’s in-game rendering API, as links are just a bunch of lines, triangles and circles. This almost allows Dana to fit Factorio’s full crafting graph on a single screen:
The Coding Part
So that’s all for the drawing board, time to throw some code at the problem to get the job done! But with that come some other problems. First, Factorio Mods are made in a language called Lua, and Lua has an ridiculously barren ecosystem. No success in finding a library that can do this kind of link routing.
Another solution would be porting a library from other languages. Sadly there are plenty of libraries to draw conventional graphs, but Dana is now dealing with links between any number of nodes. That’s not a graph anymore, but a hypergraph. While the word definitely sounds cooler, there aren’t many software libraries to draw them, and in general there’s much less scientific literature on the topic. No success in finding clues to do routing the Dana way.
So, Dana has a router made “almost” from scratch. “Almost”, because there was a lot of inspiration to be found elsewhere, it just required looking into some unexpected places…
Inspiration from PCB Design
There happen to be some people whose daily job requires linking points on a 2D plane: printed circuit board (PCB) designers. And for problems almost identical to Dana’s link routing, they have a decades-old family of well-documented algorithms: channel routers.
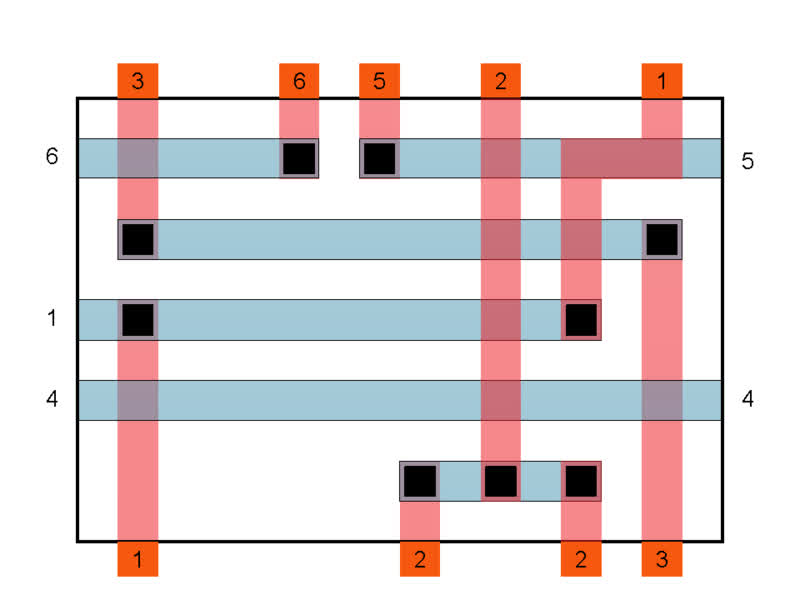
Before looking at the solution, the first things Dana got from that is a proper way to modelize the problem. The goal of our link router is twofold: Determine the number of channels between the rows of nodes, and assign a channel to each horizontal segment of the links.
Where each horizontal line starts and ends is simply determined by which nodes they must be linked to, and the vertical segments are simple projections from the nodes to the horizontal lines.
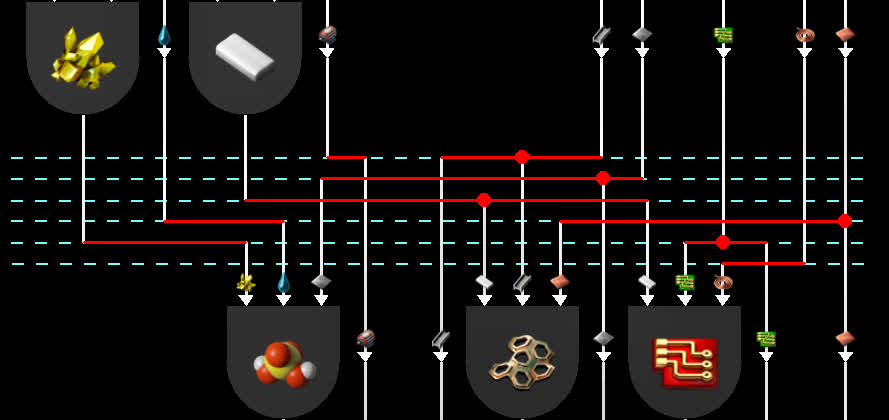
So maybe Dana could just copy/paste this solution. Let’s just place the links like tracks were placed on PCBs in the 80s!
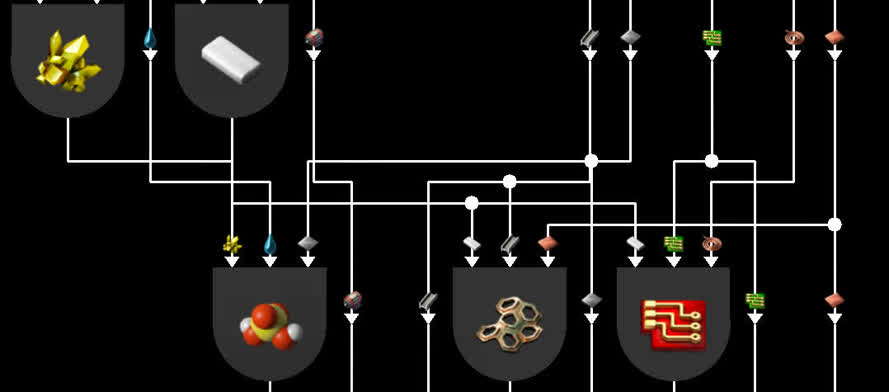
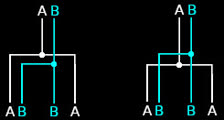
Well that’s not exactly satisfying. These algorithms were designed with the constraints of the PCB industry in mind, where link crossings are usually not a problem: only making the final PCB as small as possible really matters. But when it comes to nice™ graphs, all this tangled spaghetti is really bad. In order to fix it, Dana has to provide the router with a partial order on the horizontal lines: something telling that line A must be placed over line B to minimize crossings.
Inspiration from Sports Tournaments
To find a good vertical order, let’s start with a simple idea: For each pair (A,B) of horizontal lines, we compute the number of crossings if we place A over B, same with B over A. We can deduce that placing A over B will save (or cost) a certain amount of crossings, or possibly that it doesn’t change anything.
Sadly the above trick may result in contradictions, à la: A must be placed above B, B must be placed above C, and C must be placed above A. To get a proper order, Dana has to sacrifice some of the generated constraints, but in a way that re-adds as few crossings as possible.
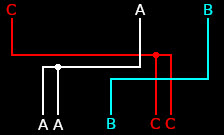
Now is the perfect time to randomly start talking about sports. Let’s rephrase the previous paragraph, but using sports terms instead. A has won against B, B has won against C, and C has won against A. To get a proper ranking, Dana has to ignore some of the matches’ results, but in a way that ignores as few score differences as possible.
The fundamental problem is the same. Luckily for us, the sports version is as old as round-robin tournaments, and the good thing about old mainstream problems is that there are a lot of smart people who have done research on it!
A generic way to solve the issue is to use graph theory, where our sports problem would be equivalent to the Minimum feedback arc set problem. The bad news: it’s an NP-hard optimisation problem. In layman’s terms: finding the best solution can be ridiculously time consuming even with just a few dozen players. The good news: there is a nice pile of research articles proposing heuristics. Those algorithms’ solutions might not be optimal, but “close enough” to optimal in “good enough” time. Various heuristics exist depending on how much computation time one is willing to pay in order to get stronger guarantees of optimality, or which can be tailored to specific types of graphs.
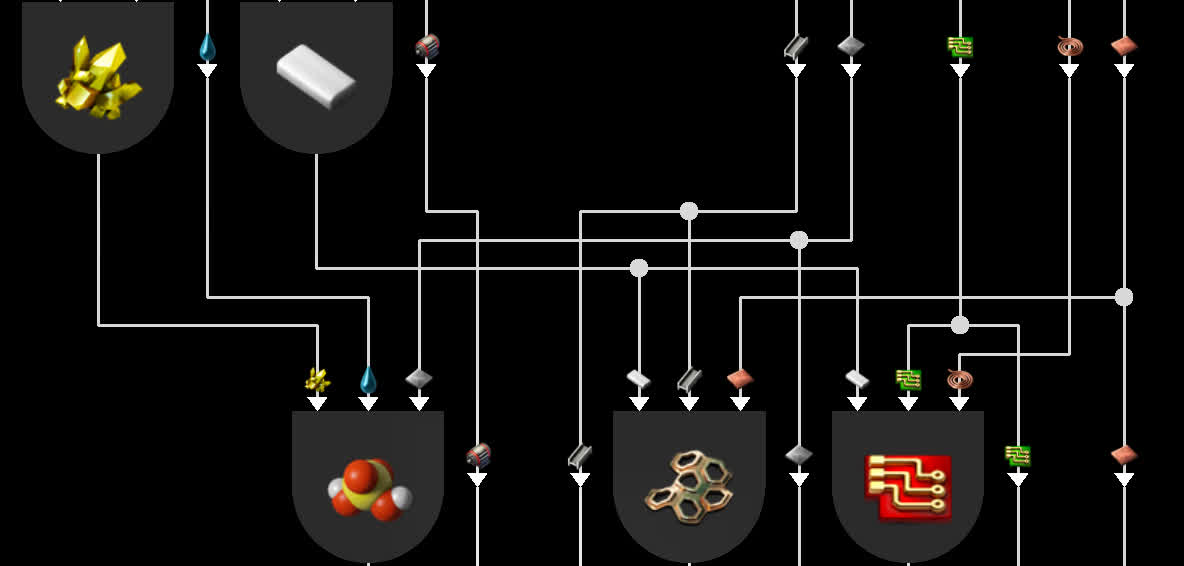
Dana uses the heuristic from Eades, P., Lin, X. and Smyth, W.F. (1993), with trivial modifications for weighted graphs. This is an extremely fast and hopefully “not too bad” algorithm to compute a partial order (these full Pyanodon graphs have to come out before the end of time, after all). It’s enough to get a much more satisfying result on the last crafting graph:
Conclusion
So that’s the short version: Dana runs a sports competition between Factorio items. Their rankings are then used to connect some resistors, capacitors and coils on an imaginary PCB in a fashionable manner. This enables Dana to generate nice™ and understandable™ crafting graphs.
Trust me, I’m an engineer.
Contributing
As always, we’re looking for people that want to contribute to Alt-F4, be it by submitting an article or by helping with translation. If you have something interesting in mind that you want to share with the community in a polished way, this is the place to do it. If you’re not too sure about it we’ll gladly help by discussing content ideas and structure questions. If that sounds like something that’s up your alley, join the Discord to get started!
